Interpretations & Studies
Data Where You Explore
Basic Data Processing
Our basic processing provides you with a suite of maps to use and combine with other data for your exploration area.
Examples:
 High Pass Residual |
 Tilt Derivative |
Total Horizontal Derivative
Interpretations
If you wish to have additional interpretation work done we can customize a plan with one of our trusted interpreters.
This will be a more comprehensive look at your area and can provide a better understanding of your prospect.
Studies
GMS also has studies for key exploration areas in the US.
These studies are a comprehensive look over key plays and fields, including Basic Processing maps as well as Interpretations. These Studies cover a complete field or play and give great insight and aid to exploration teams.
Additional Examples
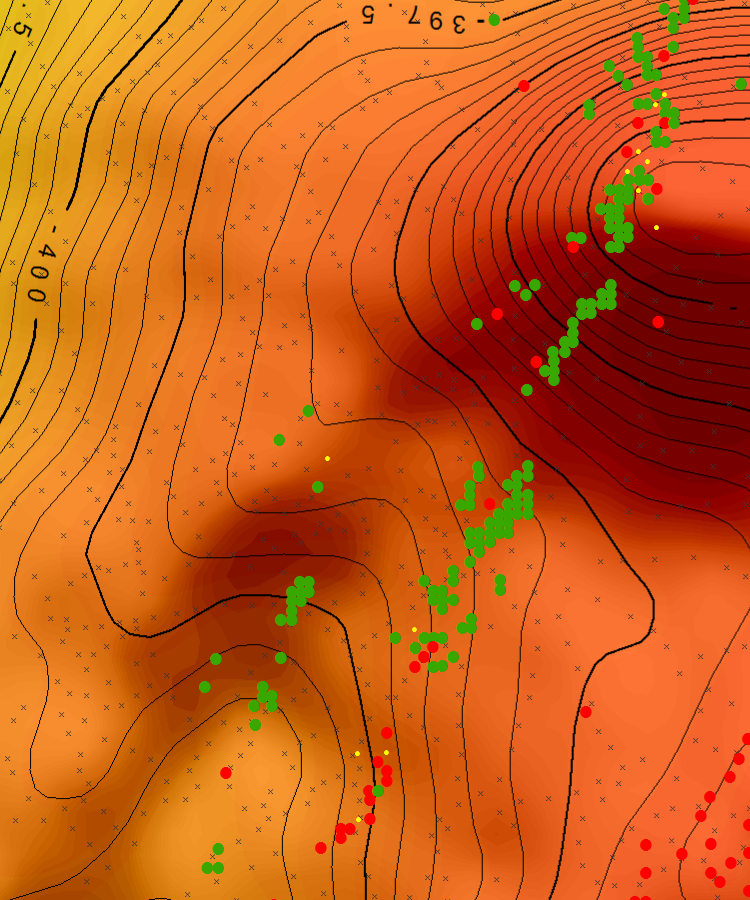
Below are some more examples of gravity data interpretations with production, as well as a brief explanation of the image.
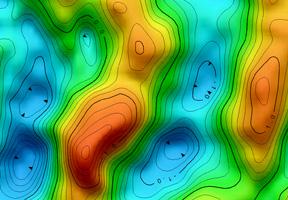
This is an example of Bouguer gravity.
The local gravity field that reflects more shallow geologic structure of interest can be seen in the anomaly shape and as subtle inflections of the contours and steepening of the gravity gradients.
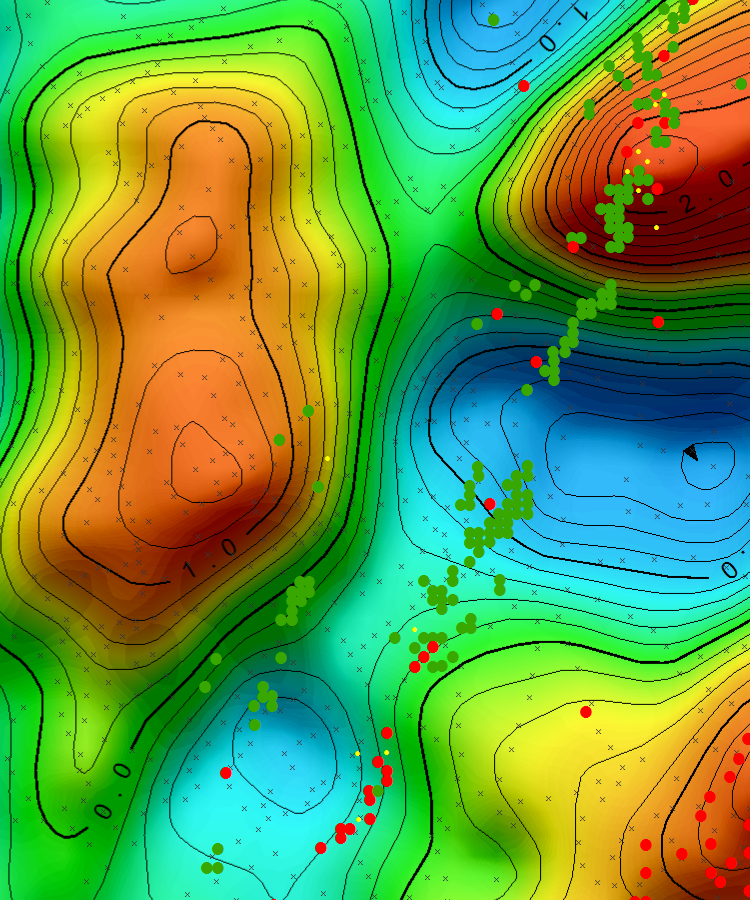
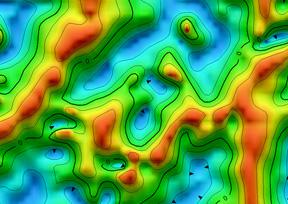
The above is an example of a High-Pass Residual Gravity Data. The removal of longer wavelength anomalies produces a residual that more strongly reflects regional and local structural trends which may be of interest. A step series of high-pass filters can be applied which will remove different wavelengths, producing residuals which correlate with a succession of target depths.
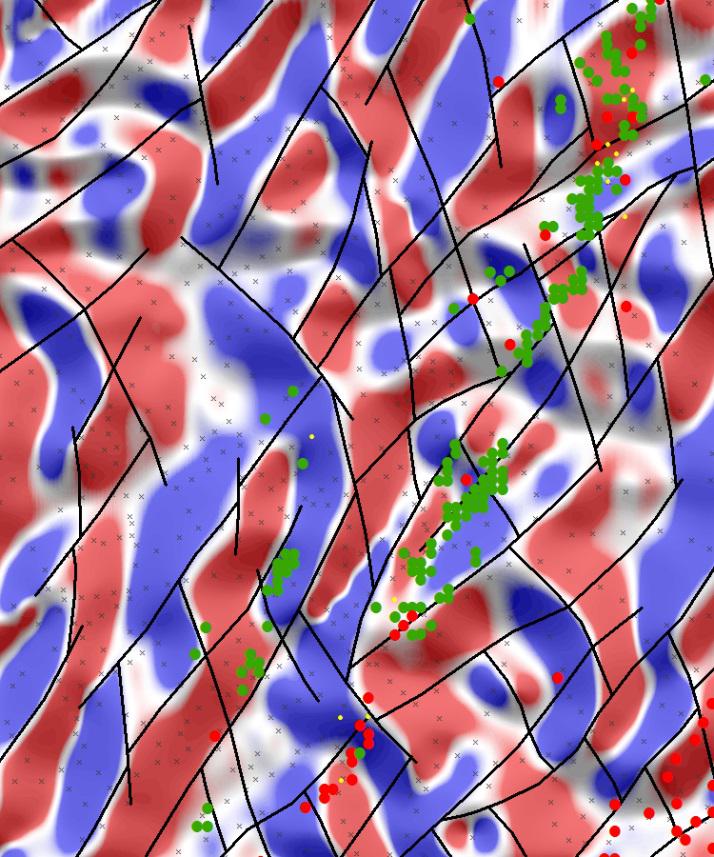
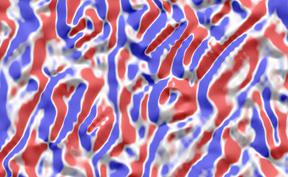
This example is of the Total Horizontal Derivatives of the high-pass gravity grid. The THD is useful to delineate faulting and structural trends with multiple orientations, and intersections of those trends. Here you can see a good correlation of interpreted faulting and production.
If you would like to know more about our Interpretations and Studies contact a GMS representave and we will be glad to Help you.